In Part 1 of this series, the process of acquiring a list of valid plat IDs was covered. Selenium in headless mode executing javascript was the primary tool, source available here. The next step is using those IDs to actually collect the GIS data.
Table of Contents
Pandas Dataframe
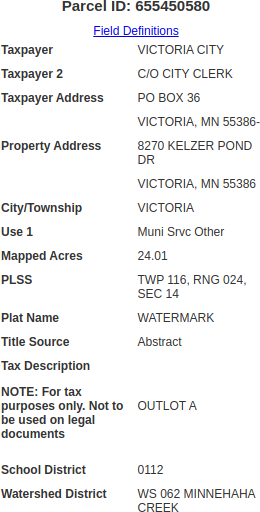
In this particular case, the table of data is known, so once a list of IDs was collected, I started to figure out how I could mine the table. Below is what an example table looks like:

Remember in Part 1, we saved all discovered parcel IDs by their Major ID number, so this miner script opens those csv files up as a dataframe:
csv_file = 'Plat_ID' + str("{0:02}".format(parcel_major)) + '.csv'

df_in = pd.read_csv(csv_file)
The pandas dataframe is then initialized with the appropriate column names, since we know the table contents in advance:
df = pd.DataFrame(columns=['Property_ID',

                               'Taxpayer1',

                               'Taxpayer2',

                               'Taxpayer_Address',

                               'Property_Address',

                               'Use',

                               'Acres',

                               'Sale_Date',

                               'Sale_Price',

                               'PLSS',

                               'Title_Source',

                               'School_District',

                               'Watershed_District'])
BeautifulSoup
Looping over the IDs, the table can be searched for within the source code of the web page. As an aside, there were some alterations made such as closing the Selenium driver after 100 executions, as I noticed, for whatever reason, Selenium seemed to get very slow after several thousand executions (unsure what was causing this). Once the page source is pulled, it is then passed into a tool called BeautifulSoup. This tool provides a clear means to search for elements in HTML. In the below code, a table element with the class, propDetails, is search for. If found, the table in its entirety resides within the table variable to be parsed later.
for parcelid in df_in['Plat_ID']:

    if(scancnt < 100):

        scancnt = scancnt + 1

    else:

        scancnt = 0

        driver.close()

        driver = webdriver.Chrome(service=srvc, options=chrome_options)


        url = 'https://gis.co.carver.mn.us/publicparcel/?pin=' + \

        str("{0:09}".format(parcelid))

    driver.get(url)

    results = []

    content = driver.page_source


    soup = BeautifulSoup(content, features="html.parser")

    table = soup.find('table', attrs={'class': 'propDetails'})
HTML Table
The table which Selenium collects is shown below:
<table cellpadding="0" cellspacing="0" class="propDetails">

    <tbody>

        <tr>

            <td class="lable">Taxpayer</td>

            <td class="data">VICTORIA CITY </td>

        </tr>

        <tr>

            <td class="lable">Taxpayer 2</td>

            <td class="data">C/O CITY CLERK </td>

        </tr>

        <tr>

            <td class="lable">Taxpayer Address</td>

            <td class="data">PO BOX 36 </td>

        </tr>

        <tr>

            <td class="lable"></td>

            <td class="data">VICTORIA, MN 55386-</td>

        </tr>

        <tr>

            <td class="lable">Property Address</td>

            <td class="data">8270 KELZER POND DR </td>

        </tr>

        <tr>

            <td class="lable"></td>

            <td class="data">VICTORIA, MN 55386</td>

        </tr>

        <tr>

            <td class="lable">City/Township</td>

            <td class="data">VICTORIA</td>

        </tr>

        <tr>

            <td class="lable">Use 1</td>

            <td class="data">Muni Srvc Other </td>

        </tr>

        <tr>

            <td class="lable">Mapped Acres</td>

            <td class="data">24.01</td>

        </tr>

        <tr>

            <td class="lable">PLSS</td>

            <td class="data">TWP 116, RNG 024, SEC 14</td>

        </tr>

        <tr>

            <td class="lable">Plat Name</td>

            <td class="data">WATERMARK</td>

        </tr>

        <tr>

            <td class="lable">Title Source</td>

            <td class="data">Abstract</td>

        </tr>

        <tr>

            <td class="lable">Tax Description<p><b> NOTE: For tax purposes only. Not to be used on legal documents</b>

                </p>

            </td>

            <td class="data">OUTLOT A</td>

        </tr>

        <tr>

            <td class="lable">School District</td>

            <td class="data">0112 </td>

        </tr>

        <tr>

            <td class="lable">Watershed District</td>

            <td class="data">WS 062 MINNEHAHA CREEK </td>

        </tr>

    </tbody>

</table>
BeautifulSoup Output
With the table acquired, we can now use the find_all function of BeautifulSoup to look for data and lable within the element td. both the data and label can be searched for to be parsed and brought into a dataframe as follows.
d = table.find_all('td', attrs={'class': 'data'})

l = table.find_all('td', attrs={'class': 'lable'})

if(d != [] and l != []):

...
The subsequent output for both the data and lable are as follows:
Data
[<td class="data">VICTORIA CITY </td>, <td class="data">C/O CITY CLERK </td>, <td class="data">PO BOX 36 </td>, <td

    class="data">VICTORIA, MN 55386-</td>, <td class="data">8270 KELZER POND DR </td>, <td class="data">VICTORIA, MN

    55386</td>, <td class="data">VICTORIA</td>, <td class="data">Muni Srvc Other </td>, <td class="data">24.01</td>, <td

    class="data">TWP 116, RNG 024, SEC 14</td>, <td class="data">WATERMARK</td>, <td class="data">Abstract</td>, <td

    class="data">OUTLOT A</td>, <td class="data">0112 </td>, <td class="data">WS 062 MINNEHAHA CREEK </td>]
lable
[<td class="lable">Taxpayer</td>, <td class="lable">Taxpayer 2</td>, <td class="lable">Taxpayer Address</td>, <td

    class="lable"></td>, <td class="lable">Property Address</td>, <td class="lable"></td>, <td class="lable">

    City/Township</td>, <td class="lable">Use 1</td>, <td class="lable">Mapped Acres</td>, <td class="lable">PLSS</td>,

<td class="lable">Plat Name</td>, <td class="lable">Title Source</td>, <td class="lable">Tax Description<p><b> NOTE: For

            tax purposes only. Not to be used on legal documents</b></p>

</td>, <td class="lable">School District</td>, <td class="lable">Watershed District</td>]
Each element within the lable array can be used to determine where in the dataframe to populate the appropriate data or more specifically, which column to place the data. Another method that likely would have worked as well would be to simply know the indexes of each element of the table, however, I did notice that based on the type of property (residential, commercial, etc…) the table format changed. This allowed at least some data collection if the format/order changed.
for idx, item in enumerate(l):

    stritem = item.text.strip()

        if(stritem == "Taxpayer"):

            tp1 = d[idx].text.strip()

        elif(stritem == "Taxpayer 2"):

            tp2 = d[idx].text.strip()

...
With each string pulled from the table, the dataframe can be appended to for this particular row/element.
df = df.append({'Property_ID': str(parcelid),

                'Taxpayer1': tp1,

                'Taxpayer2': tp2,

                'Taxpayer_Address': tpaddr,

                'Property_Address': paddr,

                'Use': use,

                'Acres': acres,

                'Sale_Date': saledate,

                'Sale_Price': saleprice,

                'PLSS': plss,

                'Title_Source': titlesrc,

                'School_District': school,

                'Watershed_District': watershed,

                }, ignore_index=True)
Final dataframe
| Property_ID | Taxpayer1 | Taxpayer2 | Taxpayer_Address | Property_Address | Use | Acres | Sale_Date | Sale_Price | PLSS | Title_Source | School_District | Watershed_District |
| 655450580 | VICTORIA CITY | C/O CITY CLERK | PO BOX 36 VICTORIA, MN 55386- | 8270 KELZER POND DR VICTORIA, MN 55386 | Muni Srvc Other | 24.01 | TWP 116, RNG 024, SEC 14 | Abstract | 112 | WS 062 MINNEHAHA CREEK |
Lastly, the dataframe is saved into csv format.
df.to_csv(filename, index=False, encoding='utf-8')
Next Step: Mapping the Data
Although the process of mining data was interesting in that I was amazed at how easily a large amount of data could be collected, the real fun comes next when this data is presented in a meaningful way. In Part 3 of this tutorial, I’ll be showing how to use folium to plot data on a geographical map.


